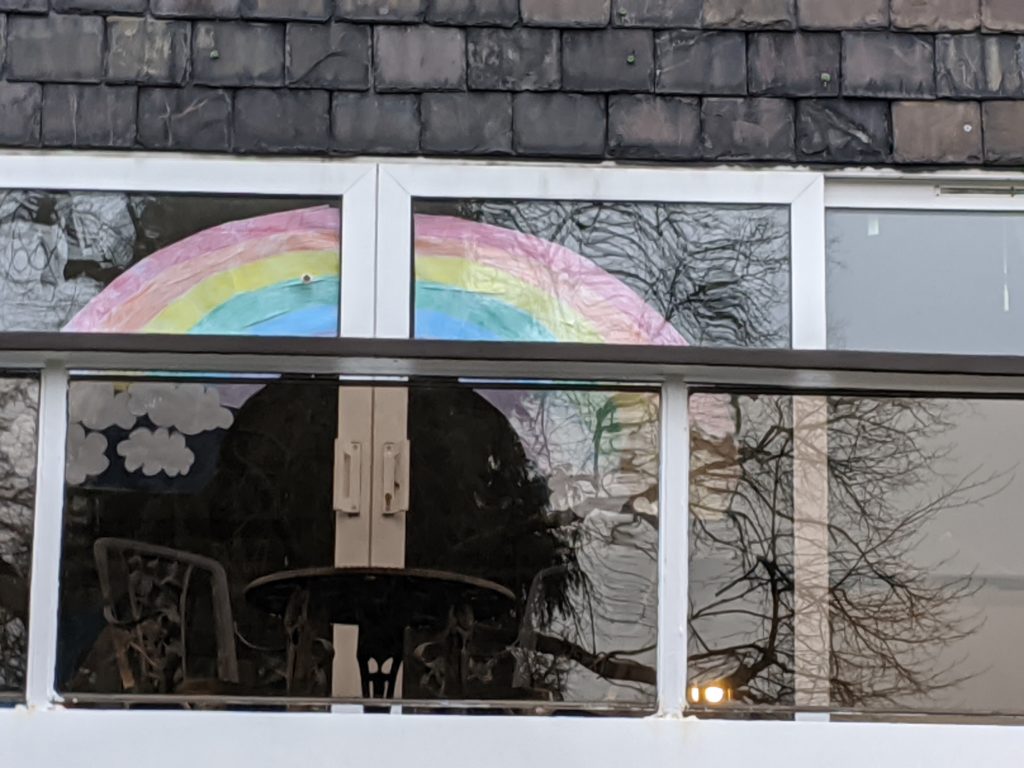
Most posts on this blog contain many numbers, but not this one. Here I wish to bring out a point made in the last post but do it by telling a story. This analogy may feel unnecessary to some but it did help me think of the issue from another perspective and it helps explain it to those that prefer stories and images to numbers and graphs.
Imagine at the start of the lock-down in March you went out for a walk each evening. And with each evening you noticed more rainbows appearing in windows. Now it’s certainly true that back in January you’d have found next to none, so it’s obvious that the rainbows were appearing in windows as people became increasingly concerned about how the NHS staff and other carers would cope with the looming threat.
But let’s say, perhaps out of lack of other things to occupy you in the lock-down, you decided to note down how many rainbows you saw on each evening’s walk and you found that the number of rainbows was still increasing.
But then it occurred to you that the weather had improved since March, evenings were lighter and your walks were getting longer and you were visiting new streets each evening. Were people still putting up new rainbows or was it just that you were viewing more houses and able to see more?
And at this point you can perhaps see the analogy. Viewing a house is like a COVID-19 test and seeing a rainbow in its window is like a test being positive. The number of positive tests you discover reflects both the number of tests that you do and the number of people infected.
But the analogy has a bit more to give.
It’s quite possible that you may view a house and fail to see the rainbow. A tree might block your view, or it may be on a window that doesn’t face onto the street you are stood on or the Sun might have melted the adhesive and the rainbow fell off (I was putting our one up two or three times a day during the heatwave). In short, you’ll miss some rainbows. It’s plausible that for every ten houses you view that does actually have a rainbow on display, you only spot it in seven of them. Conversely, you also reason that it’s next to impossible that you see a rainbow when there isn’t one there.
Seven out of ten or 70% is the typical rate of false negatives in COVID-19 swab tests. A false negative is where the person has the virus but the test comes back negative. Again, like the analogy, false positives are rare: it hardly ever happens that a test comes back as positive when the person does not have the virus.
And there’s one final point we can draw from this analogy.
In your notebook you record the date, the number of houses viewed and the addresses of houses where you saw a rainbow. This will allow you to assess, in time, whether rainbows are still going up or whether you are just going on longer walks or becoming a legendary rainbow spotter.
But you notice that some rainbows are now absent where you had seen them before. You record this on your notebook. But you realise that your method does not allow you to record all of the rainbows that have come down simply because you do not have a complete record of all rainbows that were put up.
In the analogy you can think of a rainbow coming down as being a death from COVID-19 (although in reality it symbolised a feeling that the virus was held at bay). The key point here is that in the headline figures that are published there has to be positive test prior to death for it to be recorded in the COVID-19 deaths total. There is some variation here, Public Health Scotland state the test has to be within 28 days of death, and although Public Health England and Wales don’t specify a time limit, in Wales a clinician needs to confirm COVID-19 was a factor in a death. As explained in the last post, looking at the number of deaths where COVID-19 was mentioned as cause on the death certificate avoids this problem.
Analogies are very useful but should not be taken too far and although they can help explain some aspects of an issue more clearly they can easily mislead and even generate pure nonsense (what does putting a rainbow back up represent?). Hopefully this analogy is of some use in helping people understand the COVID-19 situation.
